

Roman Garbar
Introduction
Earnings from showing ads in mobile games have seen better years, but despite the challenges, ad revenue opportunities remain strong. More and more game publishers are increasingly adopting “hybrid monetization” – a mix of in-app advertising (IAA) and in-app purchases (IAP).
While experts continue to debate the realistic ratio of IAA to IAP, whether it should be 50/50, 70/30, or 80/20, one thing is clear: ad revenue constitutes a significant portion of revenue for the majority of mobile publishers.
Tenjin has partnered with Clever Ads Solutions (CAS) to provide exclusive benchmark data to assist publishers. The report includes market share data for ad monetization channels and countries, based on a sample from Tenjin, as well as the average eCPM benchmark with a breakdown per country and format, based on data from CAS.AI.
The report will be periodically updated throughout 2024.
Last updated on August 21st, 2024
– Q2 2024 dataset has been added
– The average eCPM for Rewarded Ads on iOS has been updated.
Executive Summary for Q2 2024
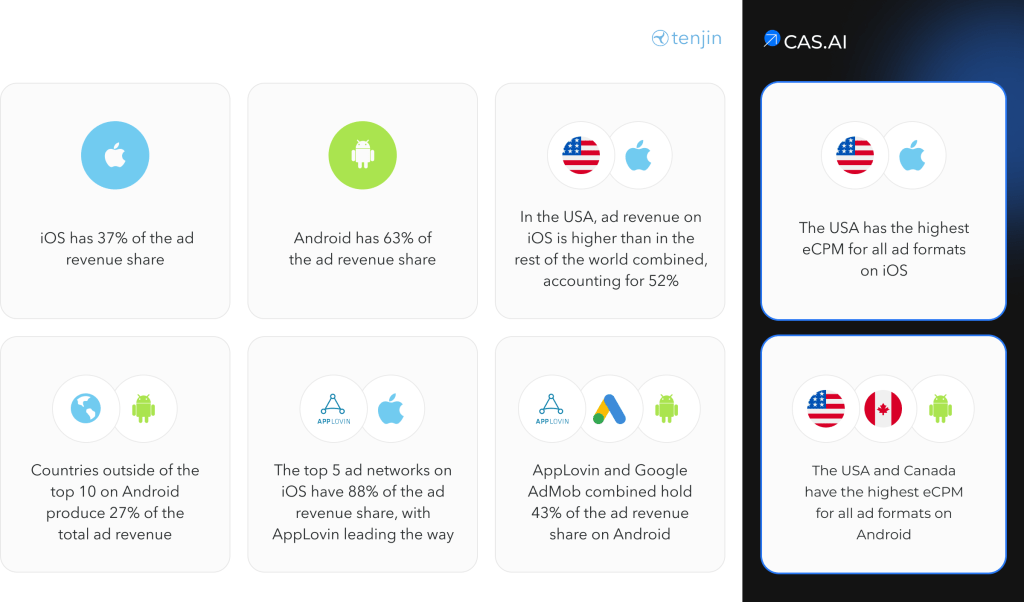
Ad Revenue Share by Platform in Q2 2024

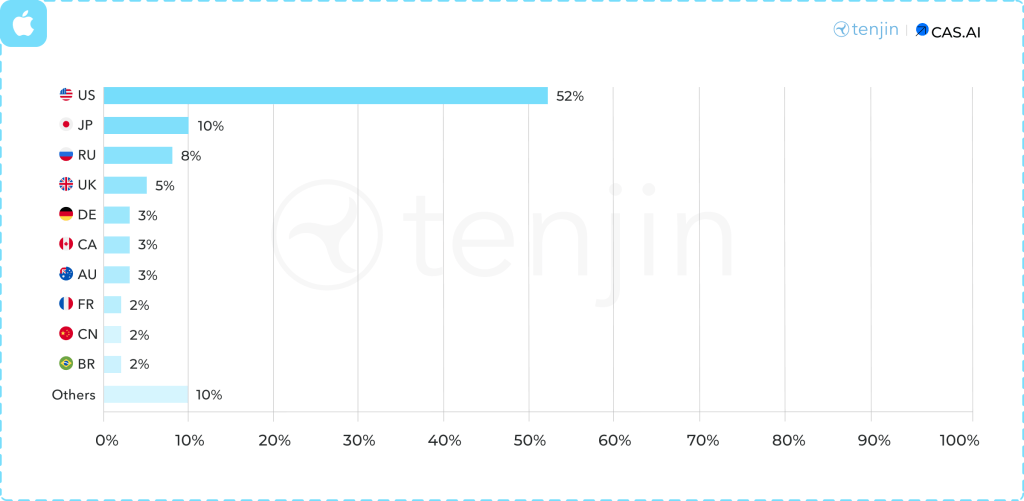
iOS Ad Revenue Share by Country in Q2 2024
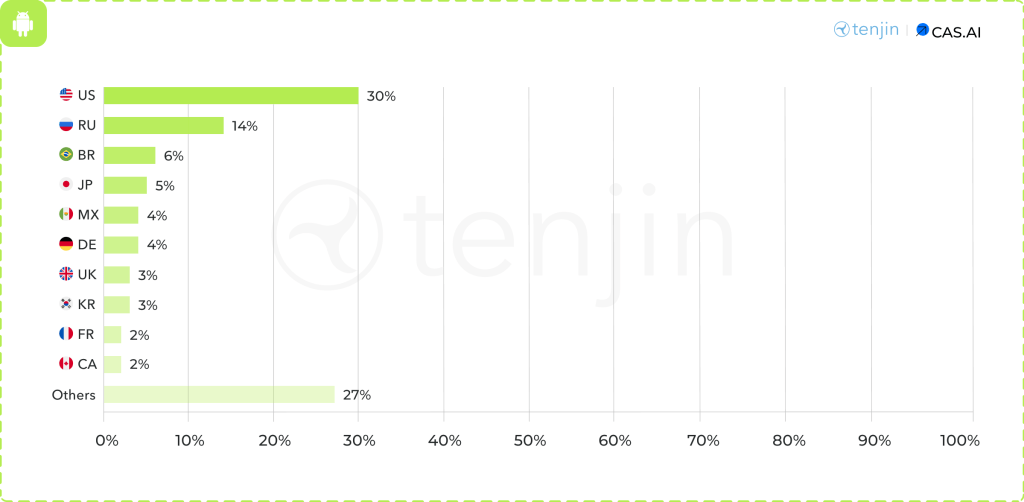
Android Ad Revenue Share by Country in Q2 2024
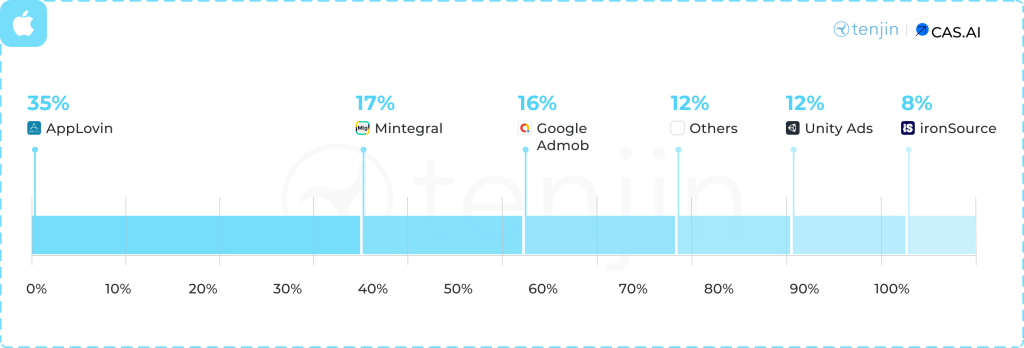
iOS Ad Revenue Share by Ad Network in Q2 2024
Android Ad Revenue Share by Ad Network in Q2 2024
Average eCPM per Ad Format in Q2 2024
Average eCPM for Banners by Country in Q2 2024
Average eCPM for Interstitial Ads by Country in Q2 2024
Average eCPM for Rewarded Ads by Country in Q2 2024
Executive Summary for Q1 2024

Ad Revenue Share by Platform in Q1 2024

This is a drastic change compared to five years ago. In 2019, iOS had 63% of the ad revenue share, while Android had 37%. Now, the situation has almost completely flipped. The change is largely driven by the introduction of App Tracking Transparency (ATT) in 2021. Most iOS users choose to opt out when seeing the ATT banner. Therefore, the value of those users diminishes for advertisers, and consequently, the potential ad revenue for publishers drops.
Tip: Increase ATT opt-in rates to boost your ad revenue on iOS.
iOS Ad Revenue Share by Country in Q1 2024
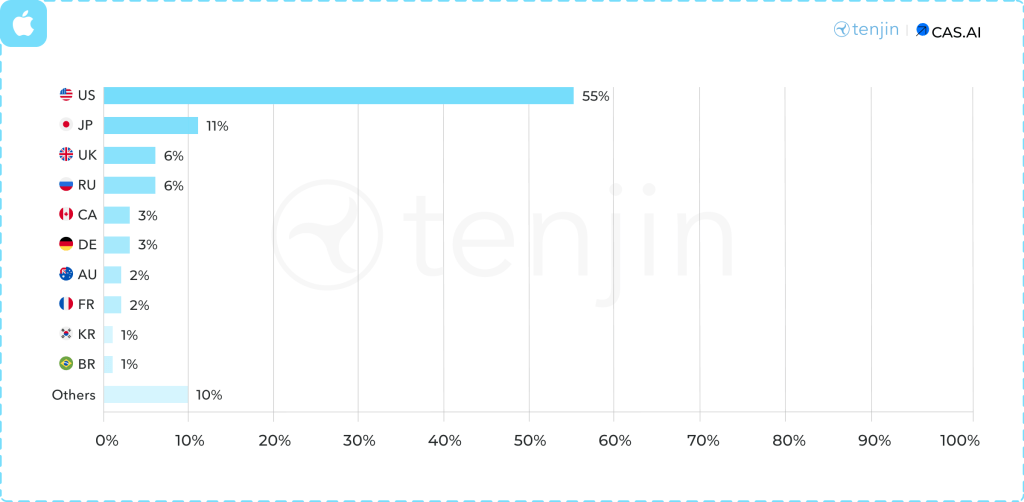
The market share on iOS is heavily skewed towards the USA (55%). Additionally, countries outside of the top 10, labeled “Others” in the image above, account for 10% of the market share worldwide.
Android Ad Revenue Share by Country in Q1 2024
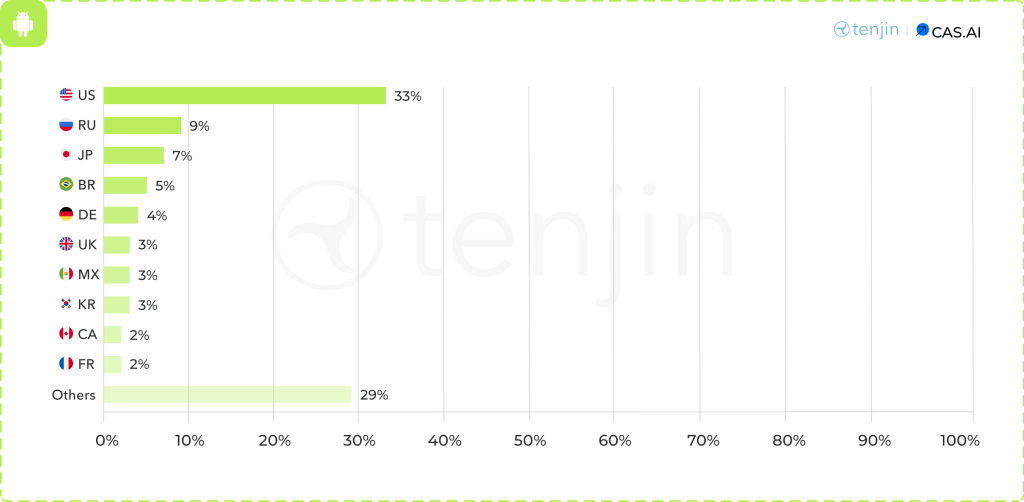
On Android, the USA holds the top spot with a 33% market share. However, the market share is significantly more fragmented compared to iOS. Additionally, countries outside of the top 10, in terms of ad revenue, collectively account for 29% of the global market share.
iOS Ad Revenue Share by Ad Network in Q1 2024

The top 5 ad networks on iOS have an 88% ad revenue share, with Applovin leading the way. The data indicates that the ad monetization market for iOS is somewhat concentrated, with Applovin (37%) in the lead, followed by Unity Ads (16%), Google Admob (15%), Mintegral (11%), and ironSource (9%). Additionally, the other ad networks collectively represent 12% of the market. This suggests that while Applovin is the dominant player, the market still has a moderate level of fragmentation among the various ad monetization channels.
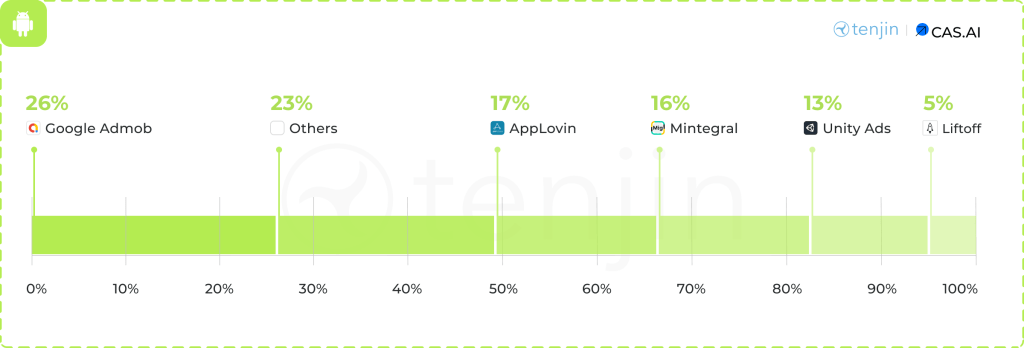
Android Ad Revenue Share by Ad Network in Q1 2024
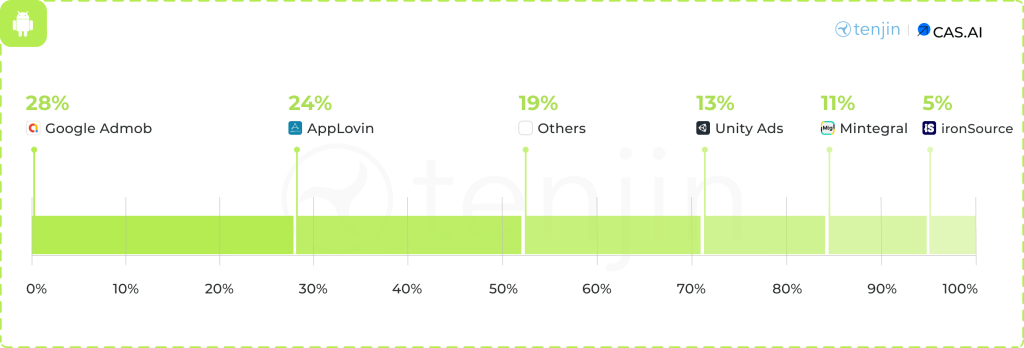
Google AdMob (28%) is leading the ad monetization market share on Android, followed closely by Applovin (24%). Unity Ads (13%) and Mintegral (11%) hold significant portions as well. ironSource accounts for 5% of the market, while other ad networks collectively represent 19%. Together, Applovin and Google AdMob hold slightly more than half of the market share at 52%. This distribution shows a diverse market landscape with several key players contributing to the ad revenue on Android.

Average eCPM per Ad Format in Q1 2024
What is eCPM?
eCPM stands for “effective Cost Per Mille,” where “mille” is Latin for “thousand.” Essentially, eCPM indicates how much revenue a publisher earns for every 1,000 times an ad is shown in their app or website.
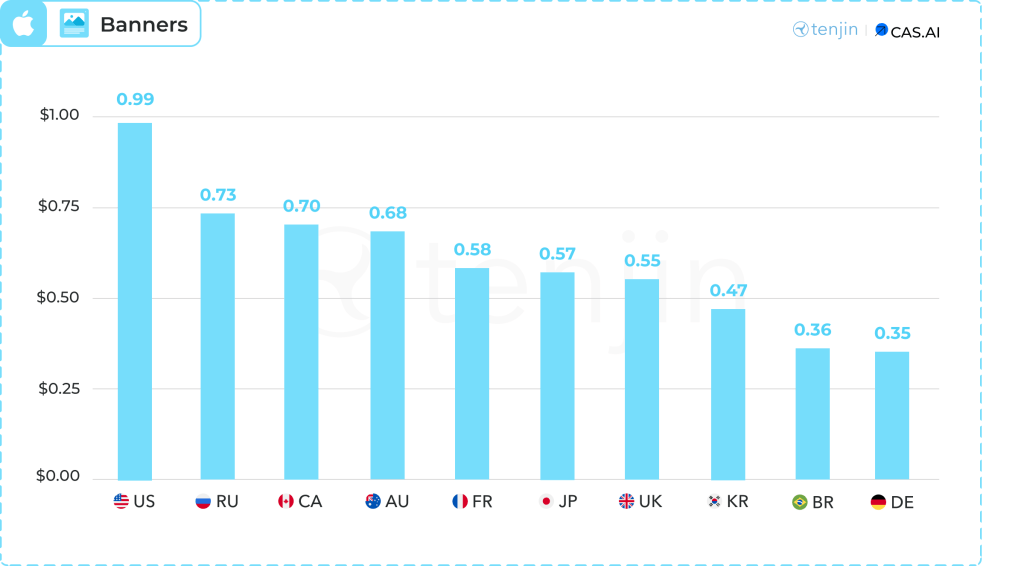
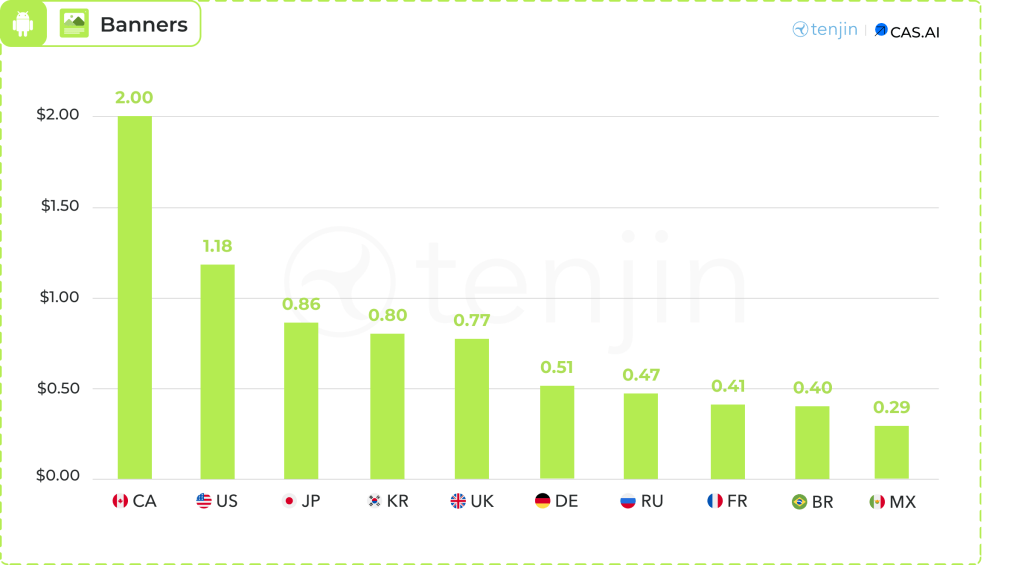
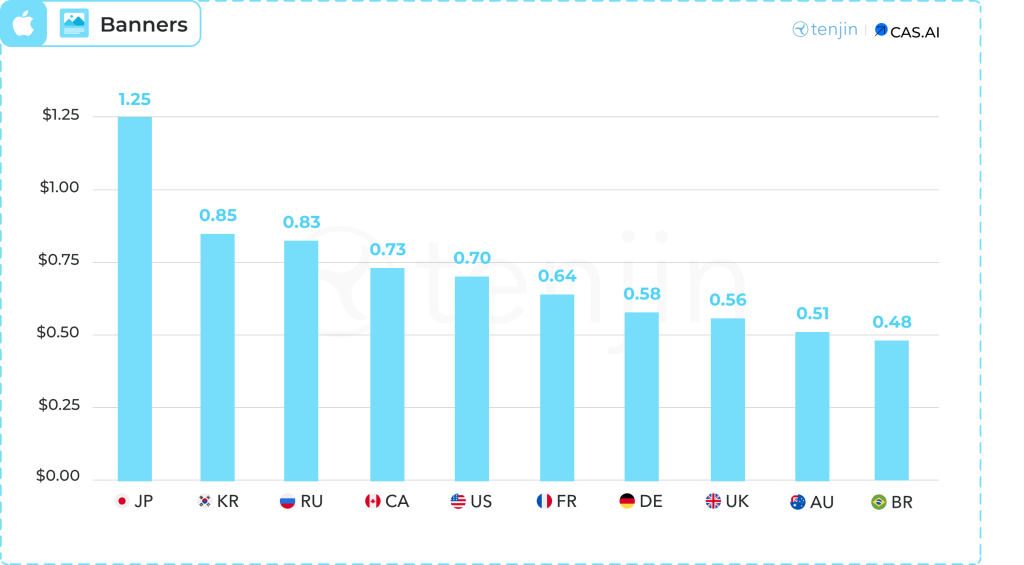
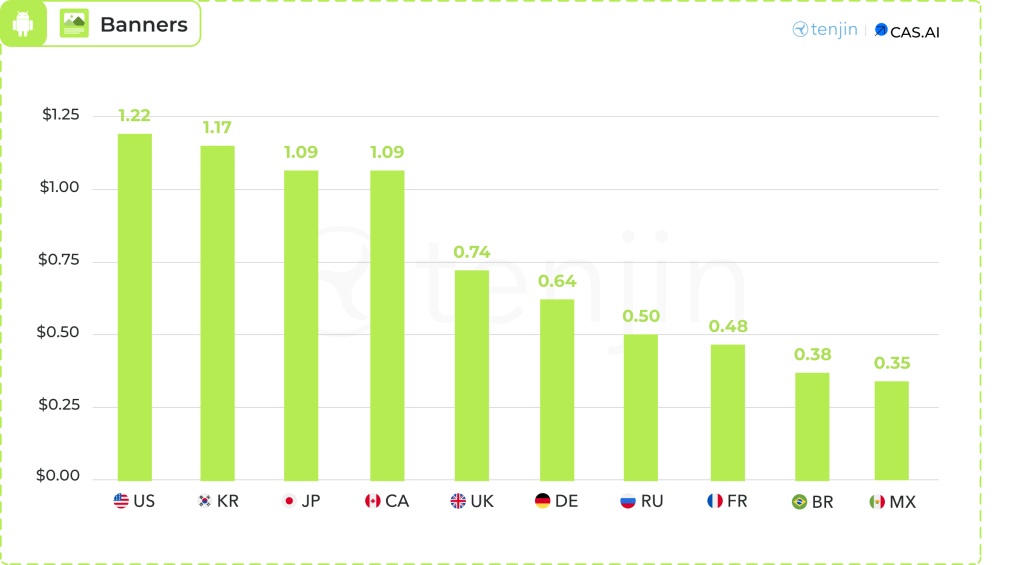
Average eCPM for Banners by Country in Q1 2024
Banners are small image ads placed within a game’s layout, visible to users throughout gameplay. These ads typically rotate automatically after a set period of time.
iOS
Android
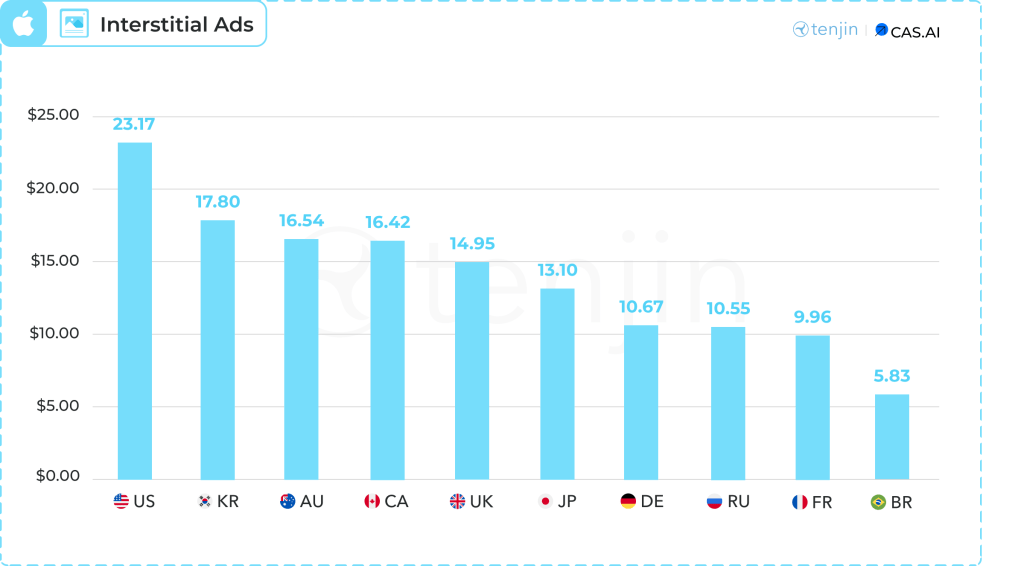
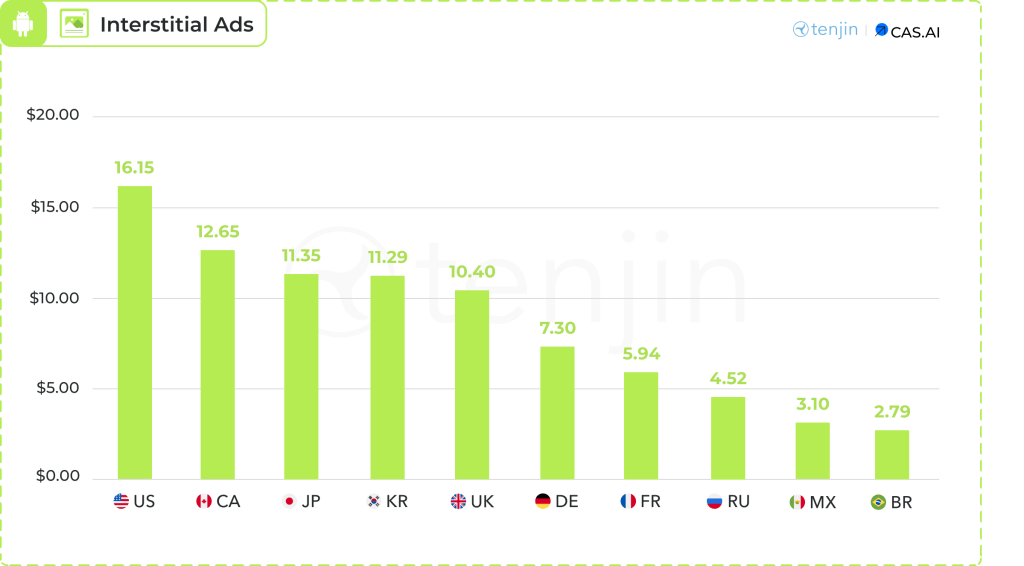
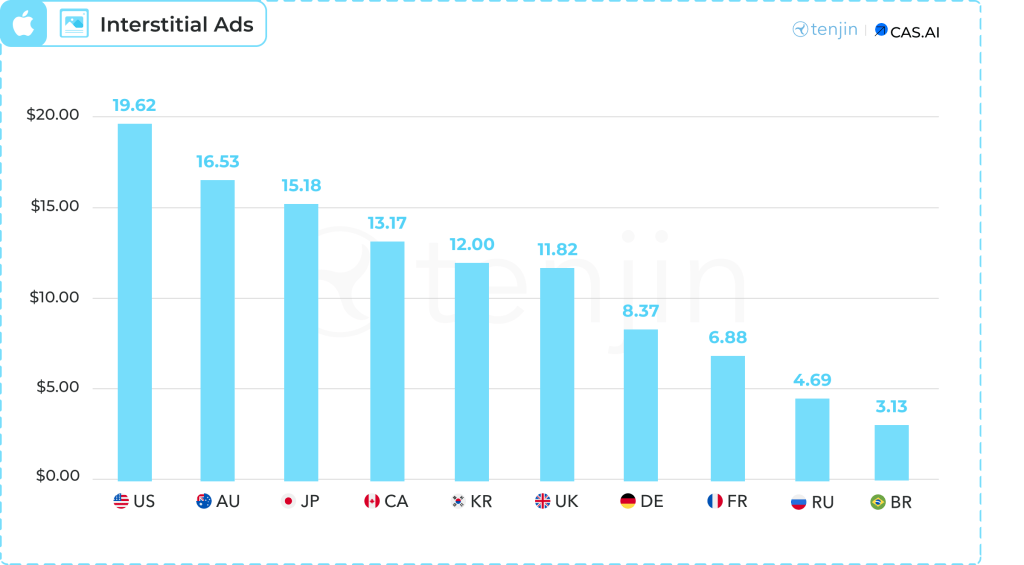
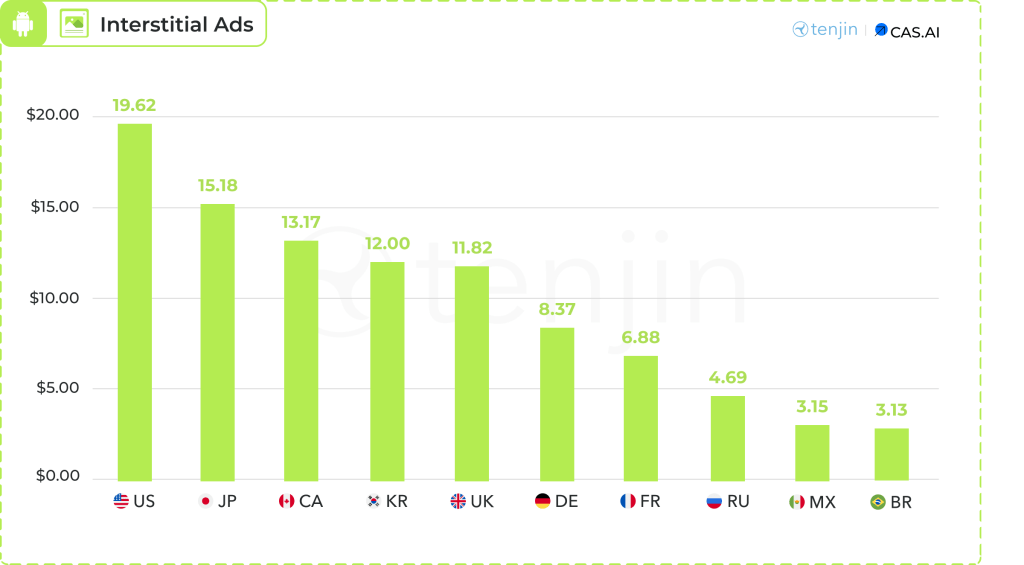
Average eCPM for Interstitial Ads by Country in Q1 2024
Interstitial ads are full screen ads that can be videos, images, or interactive content. Interstitial Ads completely cover the game’s interface not allowing a user to continue to play the game unless they choose to close the ad or tap on it.
iOS
Android
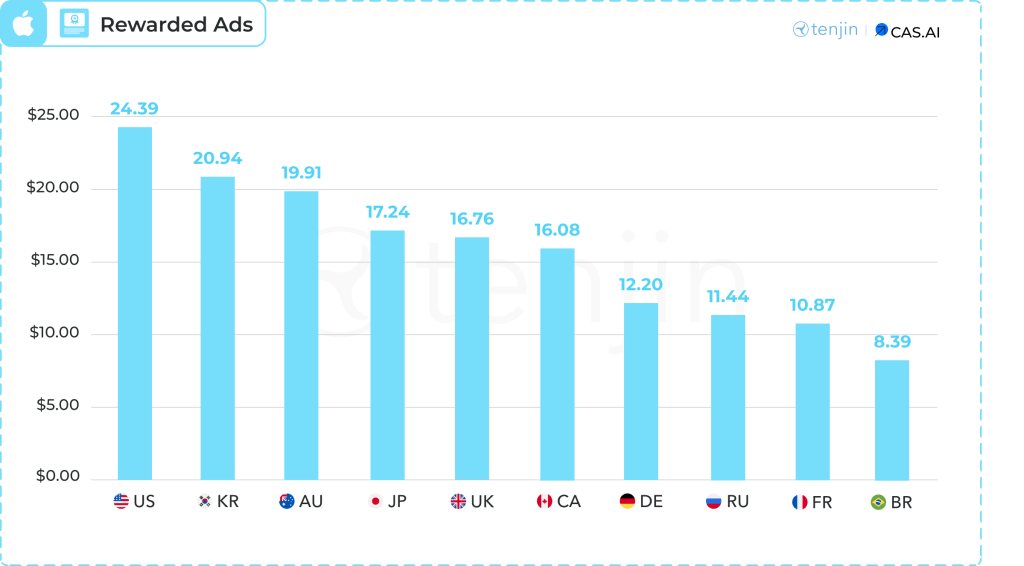
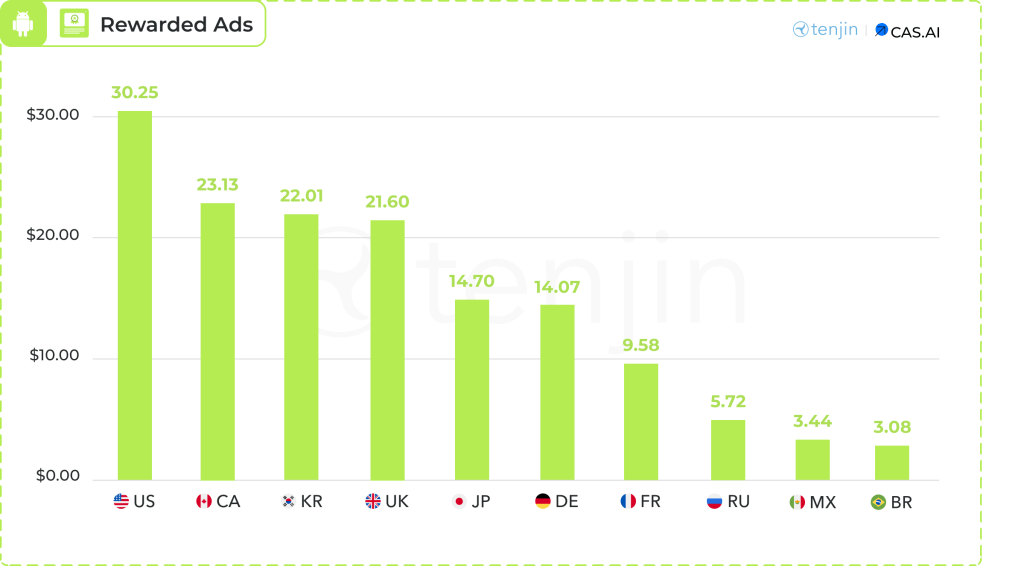
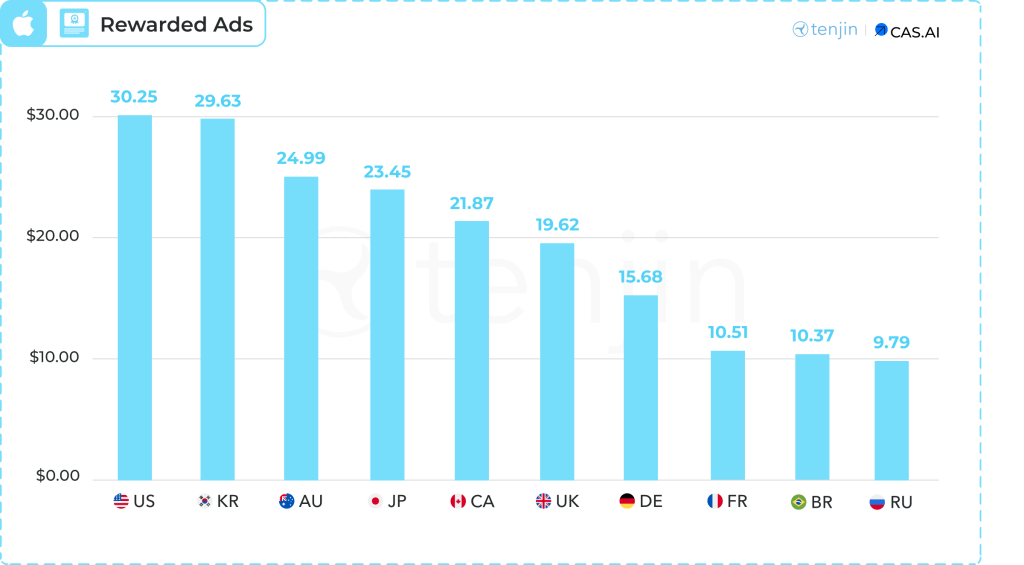
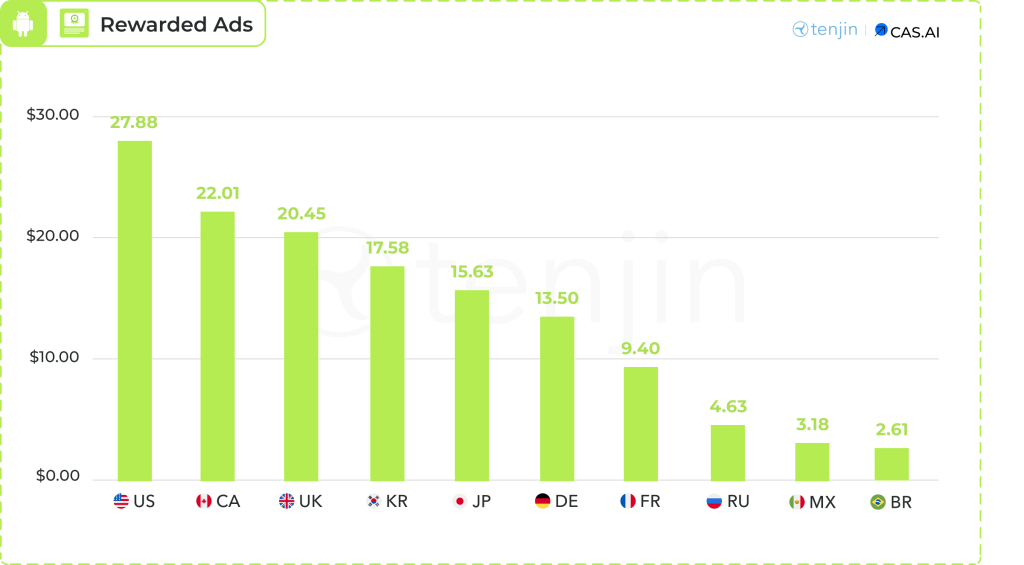
Average eCPM for Rewarded Ads by Country in Q1 2024
Rewarded ads offer users the option to watch a video or play a mini-game in exchange for an in-app reward. These ads are initiated by the user.
iOS
Android
Overall, there is a noticeable growth in eCPM, which could be attributed to the increasing number of hybrid-casual games that employ hybrid monetization strategies. Users who are willing to make in-app purchases are valued higher, leading to increased competition for them among ad networks.
Methodology
The market share portion of this report consists of anonymized data based on 146 billion ad impressions collected by Tenjin for games of all genres in the date range of 01.01.2024 – 30.06.2024.
The average eCPM portion of the report is based on data from CAS.AI, encompassing 6 billion ad impressions and excluding kids apps.