
Roman Garbar

The wait is over! The “Hyper-casual Games Insights for Advertisers” infographic for 2022 Q1 is finally out. This time we have partnered with our friends from GameAnalytics to bring you day 1 and day 7 retention benchmark in this edition of the report.
Let’s explore how the hyper-casual market has changed compared to 2021 Q3 and go through the top 10 ad networks and countries for 2022. The full report is available at the bottom of the post.
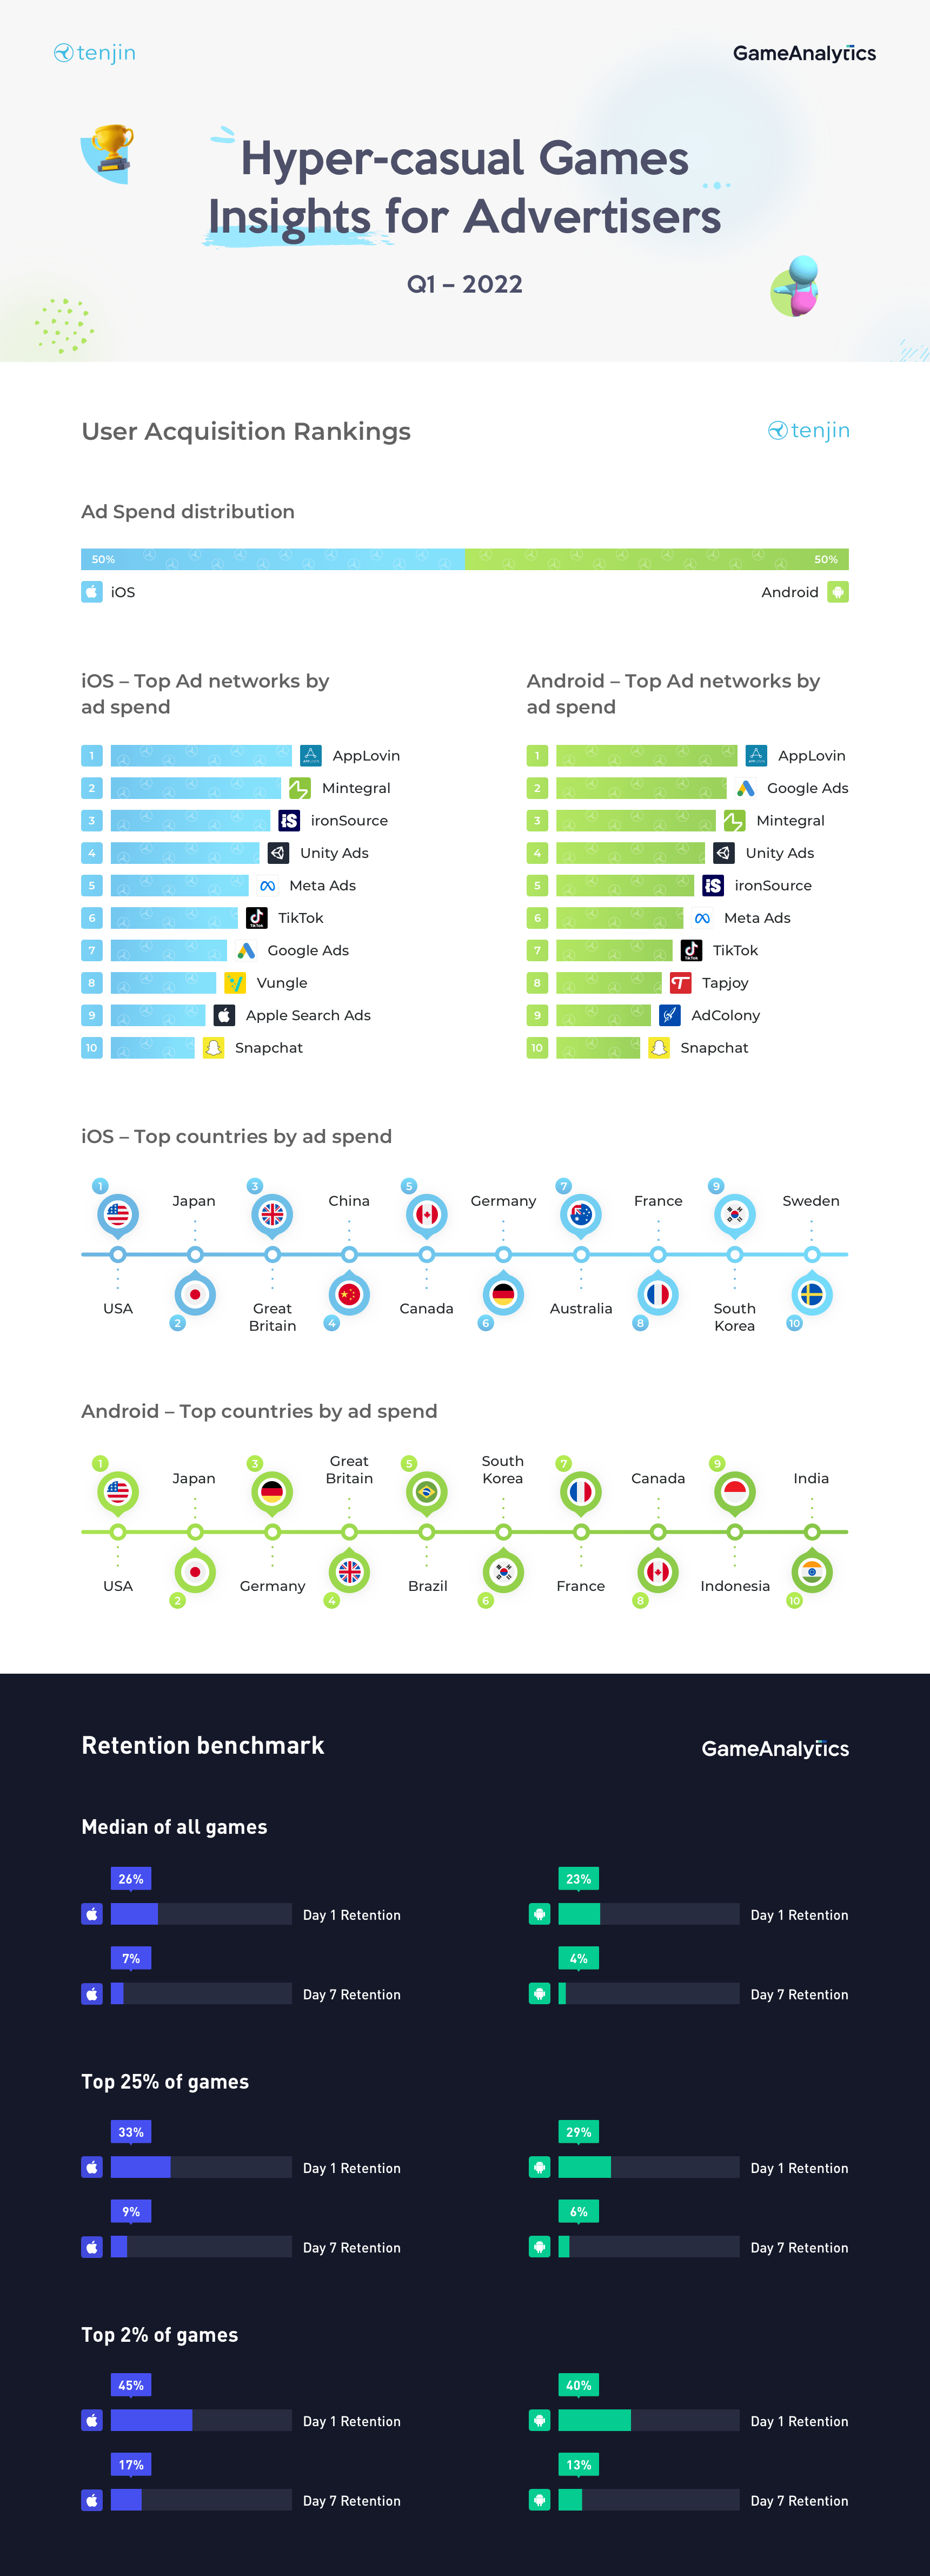
Hyper-casual ad spend by platform
In 2021 Q3, hyper-casual ad spend by platform was a bit higher on Android (55%) than iOS (45%), marking a decrease of nearly 8 percentage points in ad spend on iOS compared to 2020. In 2022 Q1, advertising spend on iOS and Android now shows a 50% / 50% split, suggesting that advertisers are becoming more and more comfortable with mobile marketing in the iOS privacy-first ecosystem.
Top 10 ad networks to advertise hyper-casual Games in 2022
8 (Applovin, Mintegral, ironSouce, Unity Ads, Facebook, TikTok, Google Ads, Snapchat) out of 10 of the top ad networks by ad spend are common to both iOS and Android. With Vungle and Apple Search Ads remaining specific to iOS and TapJoy and AdColony remaining specific to Android. Below we summarize the ranking comparison between Q3 2021 and Q1 2022.
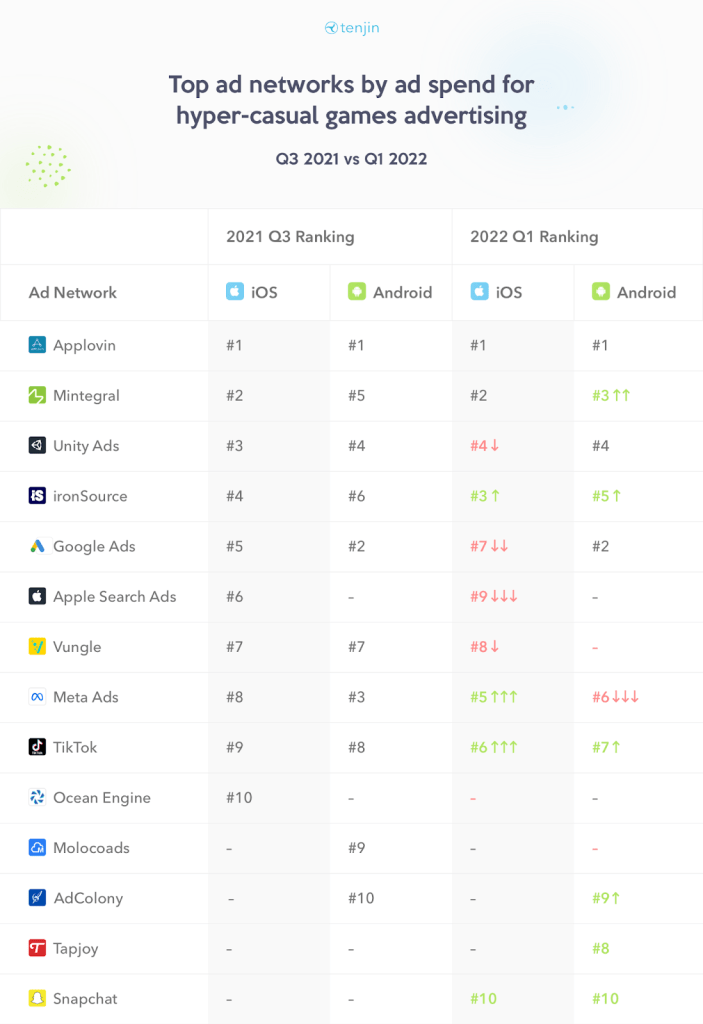
Note: The naming convention for Facebook has been updated to Meta Ads on the above table and the infographic below.
Top 10 countries to advertise hyper-casual Games in 2022
Although the US and Japan are featured at #1 and #2 on both platforms, we can observe key differences in terms of hyper-casual ad spend by platform on a country level. For instance, Android advertisers are spending more in Germany (#3) when compared to iOS (#6).
Additionally, Brazil (#5), Indonesia (#9) and India (#10) are included in the top 10 rankings for Android, but not for iOS so far in 2022.
What’s changed on a country level since 2021? When compared to our Q3 benchmark report, India and Indonesia seem to have replaced Russia and Australia in the top 10 rankings for Android, while Sweden replaced Russia on iOS.
Hyper-casual retention benchmark by platform
The retention benchmark report at the end divides hyper-casual apps that use GameAnalytics, on Android and iOS, into the following categories of retention performance: median (top 50%), top 25% and top 2%.
What exactly do these categories represent? The games retaining their users most successfully, or better than 98% of all the other hyper-casual apps, are represented in the top 2%, and the games retaining their users better than 75% of all others are represented in the top 25%. In other words, we can describe the top 2% of games as “great games,” the top 25% as “good games” and top 50% (median) as “average games”.
The statistics for “Day 1” and “Day 7” retention for each category show that there is a large gap in retention rate between a great game, a good game and an average game on both iOS and Android.
In terms of a comparison by platform, retention rate is better for hyper-casual games on iOS than on Android across all categories.
For more insight on the infographic watch our short Q&A video.
Maximize the performance of key ad networks
Are you interested in optimizing the performance of your ad networks?
We believe that automated tools, such as Growth FullStack, have empowered marketers to take control of their data and allowed them to make more confident decisions in the post-IDFA era.
Book a demo with Growth FullStack to learn how.

Roman Garbar
August 16, 2022

Ad monetization on mobile has attracted mainstream global attention recently. Even before the AppLovin-Unity-ironSource love triangle, the market was characterized by multiple partnerships, mergers and acquisitions.
Over the past few years, Tenjin has become synonymous with the success of ad revenue-driven companies: Voodoo, Ruby Games, LuckyKat, Kooapps, Kwalee, SayGames are a few notable examples. We think that means we’re pretty well-qualified to report on the ad monetization landscape, so here’s our overview of the market in Q2 2022.
Our data shows that the total ad revenue of Android apps exceeded that of iOS apps by eight percentage points in Q2. We also reveal the top 10 monetization channels and countries. The full report is available at the bottom of the post.
Ad revenue by platform
Ad revenue distribution in Q2 2022 was as follows:
If we take a look at the data from 2020, that’s a 14 percentage point swing towards Android in just two years:
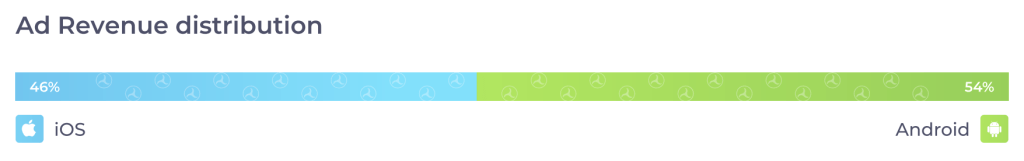
One of the highly likely contributing factors to the decline in the ad revenue on iOS is the introduction of App Tracking Transparency (ATT). Most users opt out of ATT, leading to lower eCPM and therefore lower total ad revenue.
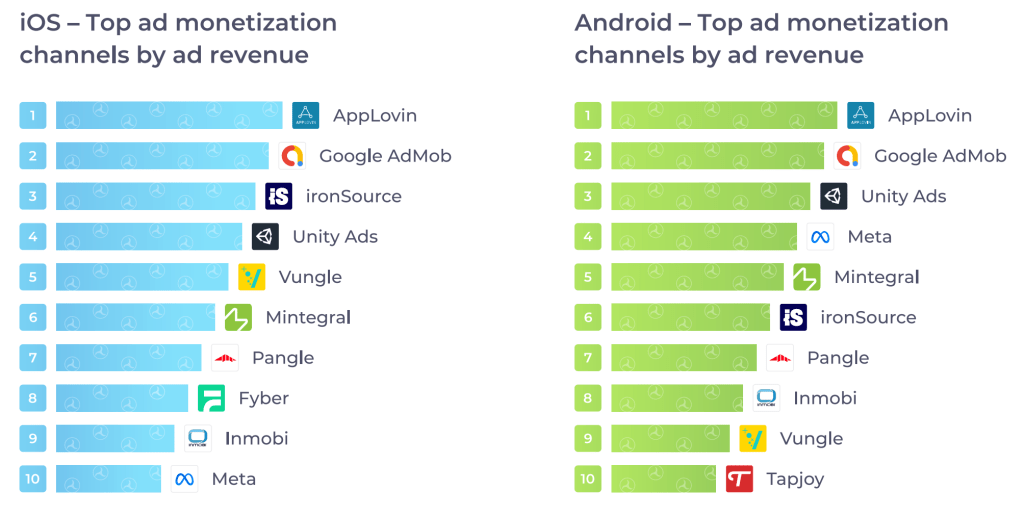
Ad revenue by monetization partner
AppLovin reigns supreme at the top of ad revenue ranking on both iOS and Google. Just two years ago, the monetization giant was at position number four in the same chart. Google Admob clinched second place both on iOS and Android. Download the report to see the rest of the rankings.
Ad revenue by country
Nothing new here: The USA is the number one revenue driver for apps that use ad monetization. Japan is number two, just as it was two years ago. The biggest mover over the past two years is the United Kingdom on iOS, which has moved up from fourth to third place.
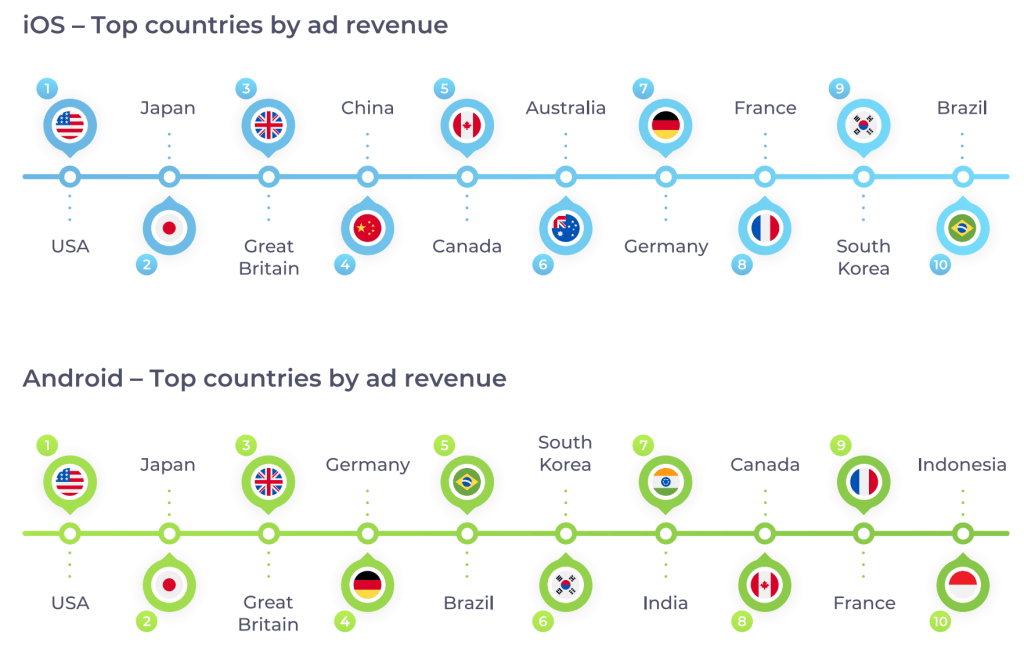
Small hint for indie developers – if you want to find some juicy low-hanging fruit for ad monetization, take a look at the bottom 2 countries in the ranking!
What comes next for the ad monetization industry?
What makes everything even more interesting is that I am not sure if there has ever been a livelier quarter in ad monetization than Q3 2022. That makes this Q2 report a benchmark ‘power ranking before seismic changes take place.
Let’s look at some of the things that might affect the current standings:
One way or another, there will be plenty of changes to talk about and compare with Q2 next time we release our ad revenue report!
About Tenjin
Tenjin offers free to start, pay as you grow advertising measurement for mobile game and app developers. As an MMP, we help small and medium-sized companies punch above their weight with marketing insights that enable them to compete with giant publishers.